Patient Experience Analysis
- Jiujun Zhang

- Dec 8, 2020
- 7 min read
Updated: Jan 23, 2021
12/08/2020


Problem Statement
Consumer relationship management has become a hot trending for both providers and insurance companies looking to promote wellness and reduce long-term spending. In today’s competitive healthcare industry, consumers have a ton of options when it comes to choosing healthcare services. Hospitals, physician practices, and health systems are becoming more focused on improving the patient experience by offering convenience, functionality, and access that modern consumers expect. There are several questions to answer:
What are vital metrics hospitals should use to measure patient experience?
What predictive models hospitals should use to predict patient experience and satisfaction?
How would hospitals create meaningful care plans and keep patients engaged with their financial and clinical responsibilities by using behavioral patterns?
How to inform care management decisions and develop stronger, more motivational relationships between patients and providers to improve long-term engagement and reduce the risks associated with chronic diseases by using predictive analytics?
To answer those questions, I am going to launch this project, which is benefit for healthcare providers' decision-making and strategy-making process, to improve their service and enhance patients relationship.
Objectives
Develop a model to predict patient experience
Looking for the key metrics for measuring and predicting patient experience
Provide proposals to hospitals to improve patients relationships and satisfaction.
Dataset
To implement the goal, I am going to choose dataset from the Official US Government Site for Medicare, which provides me the hospital compare dataset and allow me to compare the quality of care at over 4,000 Medicare-certified hospitals across the country.
I choose 3 datasets on this website:
Hospital General Information It is a list of all hospitals that have been registered with Medicare. The list includes addresses, phone numbers, hospital type, and overall hospital rating.
Unplanned Hospital Visits - Hospital This data set includes provider data for the hospital return days (or excess days in acute care [EDAC]) measures, the unplanned readmissions measures, and the result of unplanned hospital visits after an outpatient procedure. I choose "Rate of readmission for patients after discharge from the hospital (hospital-wide)" as measurement of readmission, the reason shows below: It is the overall rate of unplanned readmission after discharge from the hospital (also called “hospital-wide readmission”) focuses on whether patients who were discharged from a hospital stay were hospitalized again within 30 days. Patients may have returned to the same hospital or to a different hospital. They may have been readmitted for a condition that is related to their recent hospital stay, or for an entirely different reason. It is the overall rate of unplanned readmission shows whether a hospital is doing its best to prevent complications, providing clear discharge instructions to patients, and helping to ensure patients make a smooth transition to their home or another setting like a nursing home.
Patient survey (HCAHPS) - Hospital It is a list of hospital ratings for the Hospital Consumer Assessment of Healthcare Providers and Systems (HCAHPS). HCAHPS is a national, standardized survey of hospital patients about their experiences during a recent inpatient hospital stay.

Data Cleaning
Import Data

Data Structure

Filter Data, Drop Columns and Change df3 to Pivot

Merge 3 Datasets on 'Facility ID' by the method of 'outer'

Missing values: I choose to drop all 'Not Available' and 'Nan' values


Now, we finished the step of Clean Data, in the raw dataset, there are 5451 rows, after clean the data, we get our final DataFrame with 2308 rows * 27 columns.
Data Mining & Data Visualization
Now, let's start to explore data to get some sense of our dataset.
Import packages

Top 10 Most Satisfied States


Top 10 Least Satisfied States


Switch the comparison variables into dummy variables
Below the national average': 1, 'Same as the national average': 2, 'Above the national average':3
Hospital Ownership/ Type & Patient Experience
From the violin plot below, we can interpret that:
Voluntary non-profit private run hospitals show the highest level of patient satisfaction, while proprietary hospital ownership is associated with poor patient satisfaction.
For hospital type, critical access hospitals have more favorable patient experience ratings relative to acute care hospitals.

Quick Summary: From Data Visualization, we can know that Patient Experience are different by different types of hospitals, different types of ownership. Next we will build predictive analysis models to prove our intuitions and further mining the data.
Split Dataset
Training(50%), Validation(30%), Testing(20%).

Machine Learning Models
The supervised learning models include:
Logistic Regression (LR)
Linear Discriminant Analysis (LDA) - for classification
K-nearest Neighbors (KNN)
Decision Tree (DTC)
Random Forest (RFC)
Support Vector Machine (SVM)
Multinomial Naive Bayes (NB)

Parameter Optimization
Parameter optimization can be done by serially testing different parameter combinations using SciKit Learn's GridSearchCV method. This allows one identify parameters that perform best by a particular metric (e.g. accuracy).

It looks like we are able to predict patient experience with about 70% accuracy, Parameter optimization did not make a sizable difference in performance but did tend to decrease the variance in accuracy.
Dimension Reduction
Principle component analysis (PCA) is a form a dimensional reduction that can be used to reduce the feature number of a dataset. PCA identifies a given number of 'principle component' on a dataset.

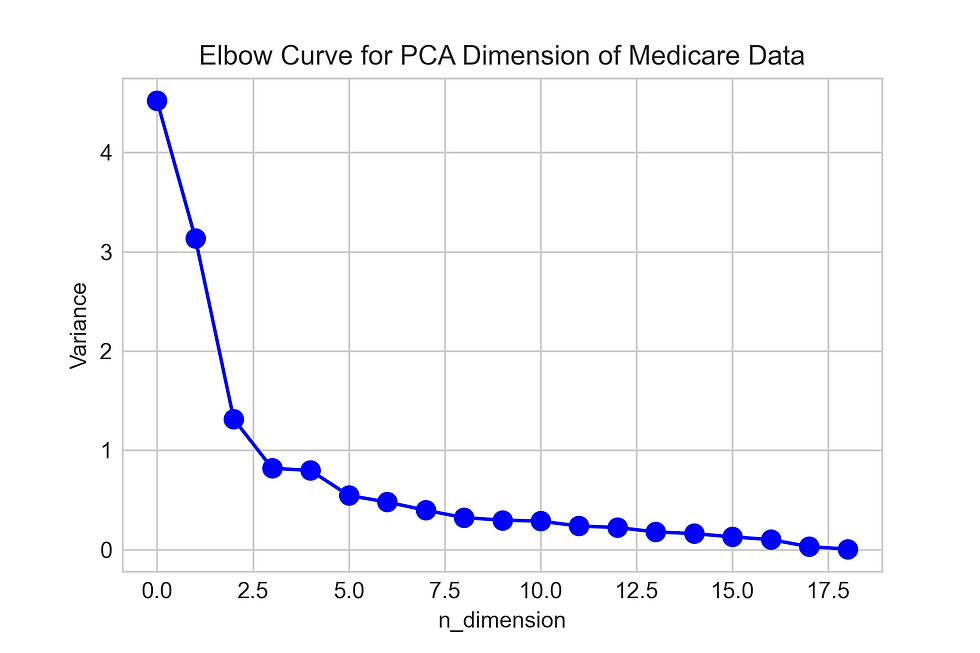
From the graph, we can see that Then we initiative a new PCA model with 13 components, the accuracy shows below:

It looks like PCA reduced accuracy of all of our models and so will not be pursued further in this analysis.
Linear discriminant analysis (LDA) is conceptually similar to PCA in that it reduces the dimensions of the data. However, LDA finds linear combinations of variables that best explain data while taking into account the differences between data classifications/labels.


It looks like LDA also reduced accuracy of all of our models and so will not be pursued further in this analysis.
Ensemble Modeling to Predict Patient Experience: Boosting and Bagging Methods
Boosting is an ensemble machine learning approaches that can combine multiple "weak" learners to improve performance.
Bagging (bootstrap aggregation) is an ensemble machine learning approaches that can combine uses bootstrapping/resampling to improve performance.

It looks like ensemble learning performed fairly well with an accuracy of 73% in predicting patient experience using Random Forest Classifier.
Visualize model performances
We visualize the model performances in 4 scenarios, we can compare the accuracy based on the box plot shows below:

From the box plot we will choose Random Forest Classifier as our best model, which accuracy is 73.19%.
Variable Importance
Last, we will see features importance so that we can know what weighs most important for Patient Experience.


Then we can know that the most important factor is Care, which means patients understood their care when they left the hospital. The top 5 features for patience experience are Care_transition,Nurse_communication, Hospital_overall_rating ,Doctor_communication, Staff_responsiveness. Then we would know that communication and response(3 out of 5) is crucial for patient satisfaction.
Conclusion
All in all, we can conclude from the models we test that:
Communication and Response are vital metrics hospitals should use to measure patient experience.
Random Forest predictive model would be the best model for hospitals use to predict patient experience and satisfaction.
Proposals for hospitals
Improve staff training: Staff need to get a monthly training to increase their awareness for improving their service and their care for patients. They can also get evaluated after each training.
Communication Competencies: Doctors, Nurse and staff should build a team and they should invite patients and family members to be in the care team, track their satisfaction more frequently.
Quick react to patients needs: Hospitals should take quick step to as they heard the complaining voice.
For Next Step: Sentiment Analysis Using Hospital Reviews
It is a very interesting fact from a survey that almost 71% of surveyed patients use online reviews as the very first step to finding a new doctor, at the same time, the majority, 37%, said they used Google reviews.
Thus, online reputation is very important for a hospital, it is a key to attract more potential patients.
In this case, I would go deeper to see how individual hospitals get information from patients' reviews, analyze they are positive or negative, and how positive or negative they are, so that Hospital can mainly focus on those negative reviews to figure out points that patients not satisfied, we can realize this by sentiment analysis.
I choose Massachusetts General Hospital as one of the example, since we only take a look at reviews of one hospital, 505 reviews in total, we would not use machine learning models to do sentiment analysis this time, I choose another way to do sentiment analysis by calculating Polarity and Subjectivity.


How could we do with Sentiment Analysis?
Scrape data from Google Reviews
After scraping data, I got a DataFrame of 494 rows *3 columns with the information of username, rating and content.

Clean Reviews
Then I clean the data by lower case all worlds, remove punctuation, remove stop worlds, then we return the world frequency of the clean data, we can see that some worlds such as "care", "great","staff","doctors","nurse" appear very often, so we can assume to some extent that the important features we got from our machine learning models are very actually what patients pay more attention to.


Calculate polarity & subjectivity
Last, I calculate the polarity & subjectivity by using Textblob, and I sort the dataset by ascending polarity, let's see what the head 30 results shows like:

So how to interpret polarity & subjectivity?
Polarity: How positive or negative a word is. -1 is very negative, +1 is very positive.
Subjectivity: How subjective/objective a word is. 0 is fact, +1 is very much an opinion.
Then we look back to see those most negative reviews, such as "disgusting staff","nothing service","took 3 hour","disrespectful nurse","poor communication", then from the perspective of hospital, senior managers should investigate as soon as possible and solve those issues.
What's next?
To make the conclusion more persuasive, I would scrape hospital reviews data all over the US in the future, then we can do another project based on sentiment analysis using machine learning models.
Summary & Insights
In this article, I started from the government data about Patient Experience, through machine learning, I got to know that Communication and Response are vital metrics hospitals should use to measure patient experience.
Then we go for individual hospital reviews example to see whether features we got are important for patient experience or not. Then we can conclude from the results that those unsatisfied patients were disappointed with poor communication, disrespectful nurse, which proves our conclusion to some extent. Sentiment analysis is so important for individual hospitals to know their weakness and improve patient experience.


Comments